Polarography
What is Polarography?
Polarography is the measurement of the current that flows in solution as a function of an applied voltage. Polarography is a voltammetric technique in which chemical species (ions or molecules) undergo oxidation (lose electrons) or reduction (gain electrons) at the surface of a dropping mercury electrode (DME) at an applied potential.
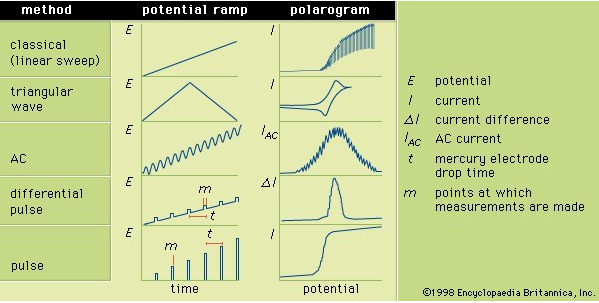
The actual form of the observed "polarographic wave" depends upon the manner in which the voltage is applied and on the characteristics of the working electrode. The working electrode is often a Dropping Mercury Electrode (DME), and the polarographic wave thus has oscillations imposed on it from the variations in mercury drop size.

As above, you can see that, as variation in potential in graph (A), we can see variation of current with respect to potential in graph (B). Those are graph of polarograph.
then, let's see how that works !
Principle:
Polarography consists of electrolysing a solution of an electroactive substance between a dme (cathode) and some reference electrode (anode). The area of the anode is large correspondingly so that it may be regarded as unpolarized and the potential of such electrode remains fairly constant.
The current-potential characteristics can be studied with the type of an apparatus in a simple manner in which the voltage applied to the cell C is adjusted by means of a potentiometer P and the current through the cell is read on galvanometer G.

This
experiment employs two methods of applying the voltage, a linear sweep (DC)
and a differential pulse. The working electrode employed is called a Static
Mercury Drop Electrode (SMDE), and provides a more sensitive measurement of
the faradaic current than the more traditional DME. The contrast between it and
a standard DME is illustrated in the above figure.
At applying the potential among two electrodes and increasing its value in a stepwise manner the following processes take place. At first only a small current flow - the so called residual current. This continues until the decomposition potential of the reducible ionic species is reached. At this point the following reaction takes place,
Mn+ +ne ↔ M(Hg) (Reducible)
Further a steep rise in current is observed and will continue to rise with increasing potential till the current reaches a limiting value.

As above we can see that, types of variation in potential brings types of signal waves for current characteristics.
Polarogram:
Polarogram is plotting graph of current vs potential to determine ions in solutions and this graphs are used for analysis purpose. The instrument used to do this analysis called Polarograph.
 |
| Picture Credit to Encyclopedia Britannica |
Applications:
- To determine trace materials in pharmaceuticals products
- To estimate drug with metal part
- Quantitative & Qualitative Analysis
- Miscellaneous substance Analysis
Thanks & Keep Learning

Comments
Post a Comment